Issuance in March increased for the third consecutive month, helped by a surge in refundings and several billion-plus dollar deals, as increased demand and fewer economic headwinds led to greater issuer confidence.
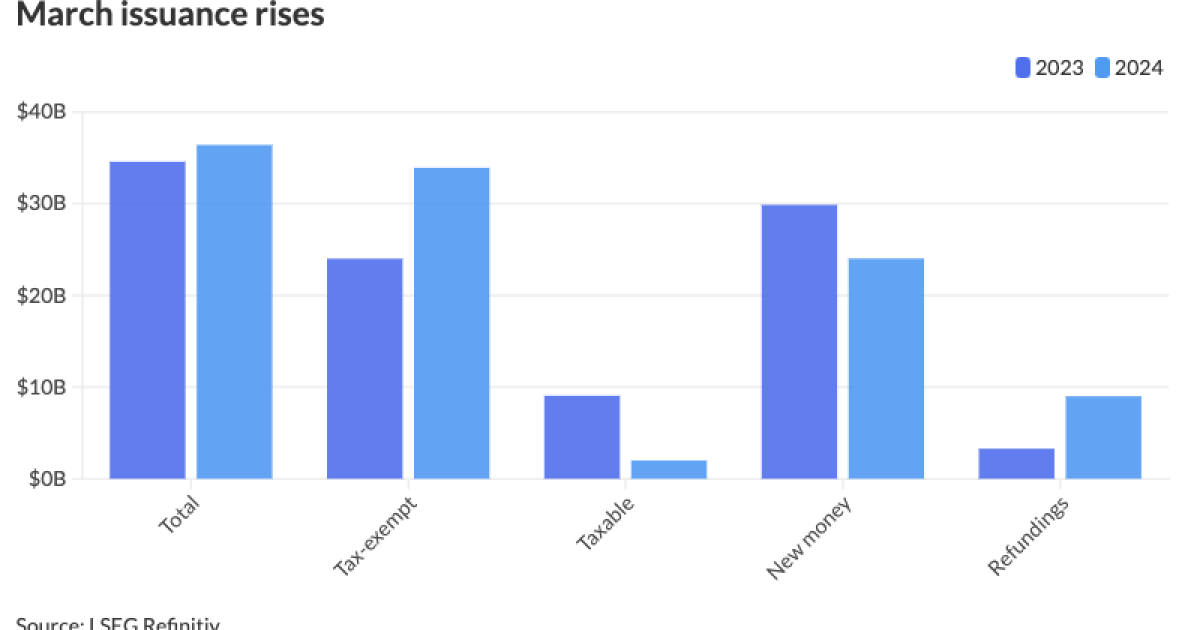
March’s volume rose 7.1% to $36.405 billion in 532 issues from $34.008 billion in 601 issues in 2023. Issuance in March is above the $34.579 billion 10-year average, according to LSEG Refinitiv data.
Issuance year-to-date ticked above $100 billion, as Q1 rebounded after a slow 2023, due to issuers still flush with federal money and widespread fears of an impending recession, said Matt Fabian, partner at Municipal Market Analytics, Inc.
Issuance in the first quarter stood at $100.231 billion, up 25.2% from $80.075 billion in Q1 2023.
Several factors contributed to the uptick in supply this month.
For one, demand has increased, with issuers more confident to come to market following the shift of inflows into muni mutual funds, said Cooper Howard, a fixed income strategist at Charles Schwab.
The economy also continues to be “humming along,” with more tailwinds than headwinds, boosting issuer confidence to take on some added debt, Howard noted.
Supply was helped by several billion-plus dollar deals,
Tax-exempt issuance rose 41.3% in March to $33.917 billion in 472 issues from $24.002 billion in 539 issues in 2023.
New-money fell 19.6% to $24.019 billion from $29.871 billion a year prior as issuers may be holding off on launching projects until the Fed begins cutting rates, Fabian said.
Additionally, with issuers focused on scooping up as many federal grants as they can before the programs expire, it reduced their need to tap the muni market, he added.
But with the odds of a recession becoming less likely, Fabian said, issuers are now able “to pull the trigger” on their financings.
Once the Fed starts cutting rates, it will become a more “advantageous” market, he said.
Refunding volume surged to $8.993 billion from $3.282 billion in 2023, marking a 174% increase. This is due in part to a resurgence of issuers refunding outstanding Build America Bonds, market participants said.
Despite
These deals include the billion-plus deal from Washington, along with the New York State Environmental Facilities Corp. with $717.295 million of subordinated state revolving fund bonds and
Several other deals are slated on the horizon, though Barclays strategists noted, “the pace of these calls has slowed substantially, as municipal issuers are still awaiting the outcome of investor actions.”
Many participants expect issuance to be front-loaded this year as issuers will come to market before the November election, Howard said.
This spike in issuance will continue for the next seven months as issuers feel more comfortable borrowing ahead of an unpredictable outcome, Fabian said.
Issuance details
Revenue bond issuance increased 11.1% to $22.716 billion from $20.455 billion in March 2023, and general obligation bond sales ticked up 1% to $13.689 billion from $13.553 billion in 2023.
Negotiated deal volume was up 18.3% to $32.060 billion from $27.098 billion a year prior. Competitive sales decreased 17.9% to $3.990 billion from $4.862 billion in 2023.
Bank-qualified issuance fell 19.1% to $520.9 million in 140 deals from $644.1 million in 175 deals a year prior.
In the states, the Empire State claimed the top spot year-to-date.
Issuers in New York accounted for $14.975 billion, up 53.6% year-over-year. California was second with $14.934 billion, up 32.1%. Texas was third with $12.719 billion, down 11%, followed by Massachusetts in fourth with $4.809 billion, up 166%, and Alabama in fifth with $4.485 billion, an 88% increase from 2023.
Rounding out the top 10: Washington with $3.232 billion, up 183.4%; Wisconsin with $3.008 billion, down 0.6%; Florida with $2.941 billion, down 5.2%; New Jersey with $2.769 billion, up 371.9%; and Georgia with $2.656 billion, up 4.9%.